COVID-19 Epidemic Trends
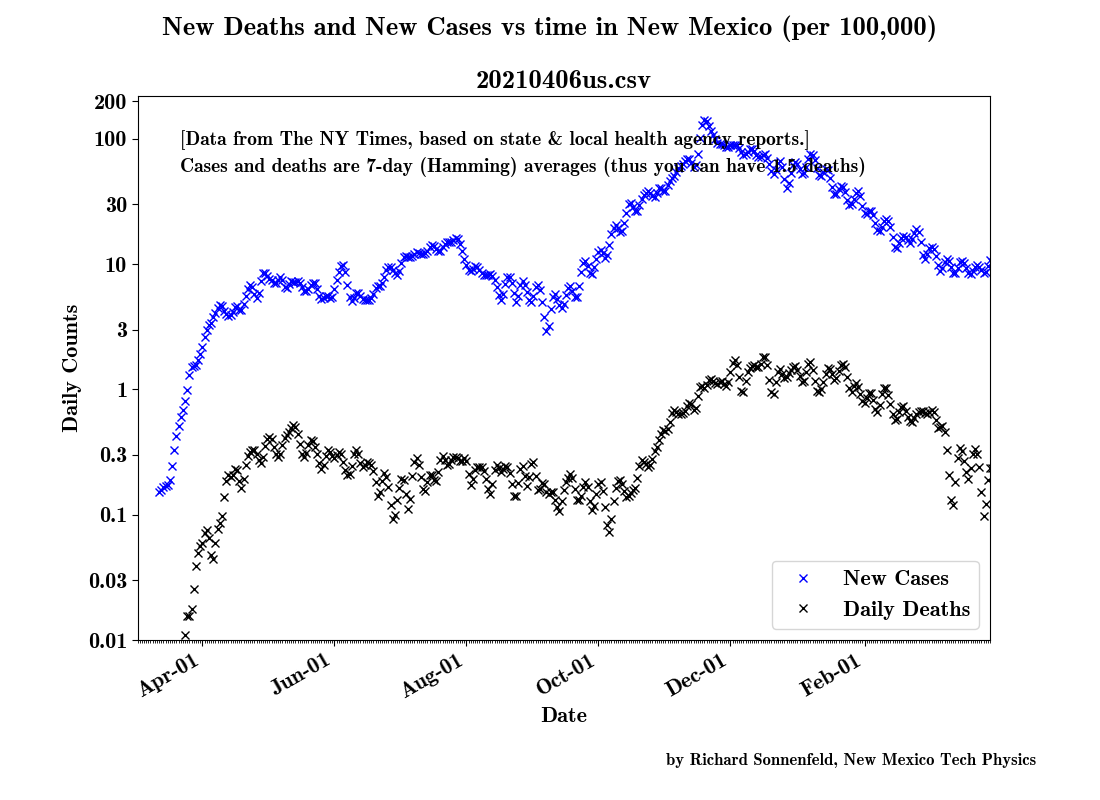
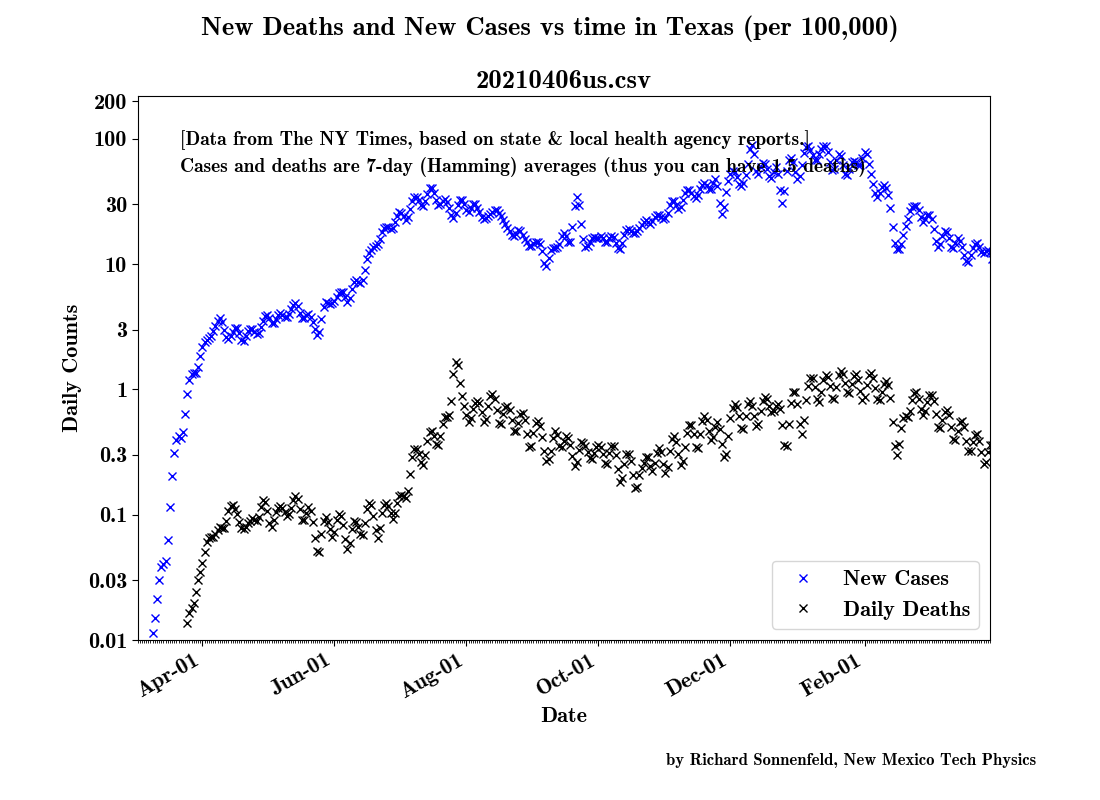
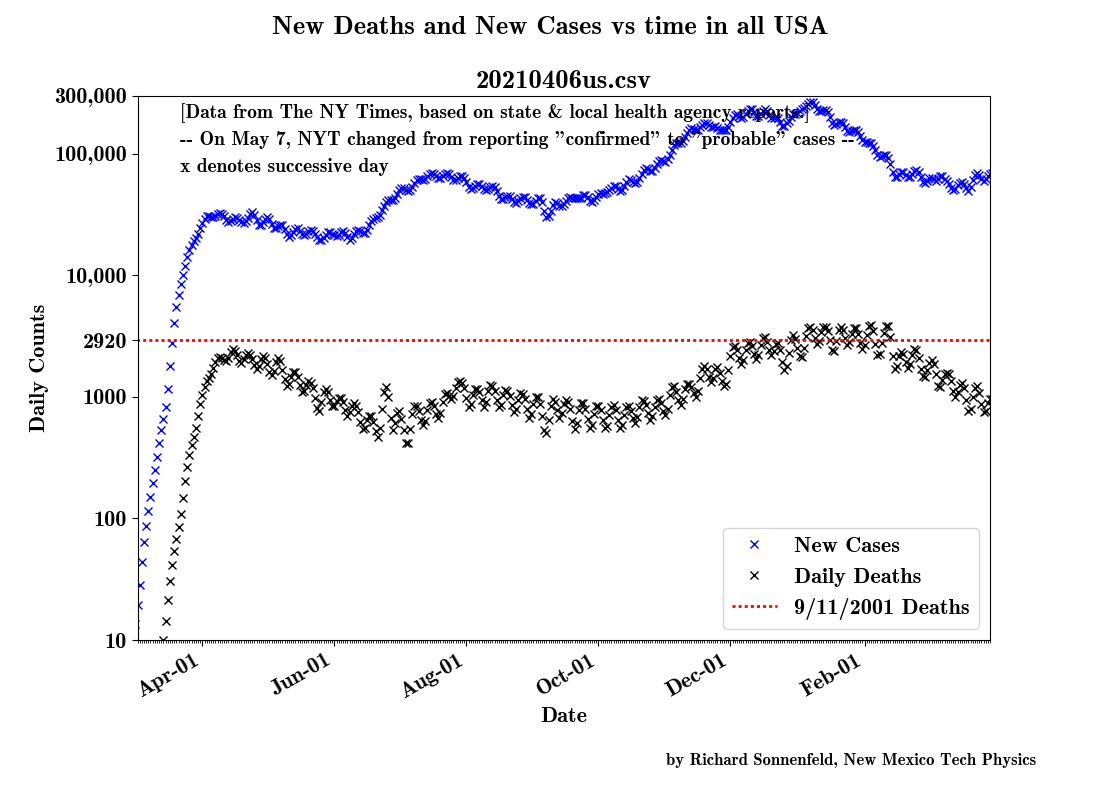
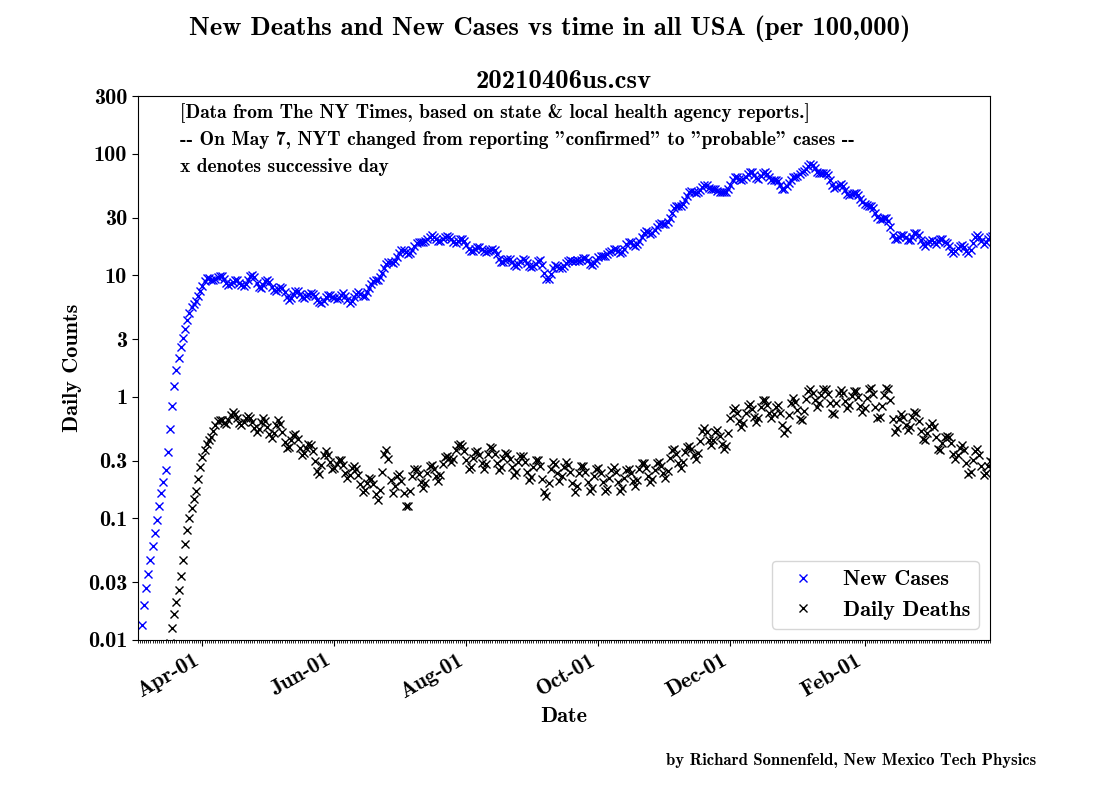
All plots generated using data collected by the New York Times from public health agencies around the US. The raw CSV files are published here:
https://github.com/nytimes/covid-19-data
- The python code used to generate these plots is HERE.
Please e-mail to
richard.sonnenfeld@nmt.edu if you use it, or if you improve it.
-
- To see a simple estimate of the risk of being in a room with an infectious
person for various gathering sizes. CLICK HERE (pdf).