This paper presents analyses of five tropical disturbances of various types, derived from observations made over the northwest Pacific in August and September of 2008. Various dynamic and thermodynamic products were derived from dropsonde and airborne Doppler radar data, with the goal of increasing our understanding of tropical cyclogenesis. From these analyses we draw the following tentative conclusions:
The formation of a strong mid-level circulation, with its associated cold core at low levels and warm core aloft, greatly aids the spinup of a tropical cyclone by changing the vertical mass flux profile of deep convection from top-heavy to bottom-heavy. This has two effects: (1) The enhancement at low levels of the convergence of mass, and hence vorticity, thus aiding the spinup of a warm-core vortex; (2) The suppression of the lateral export of moist entropy by deep convective inflows and outflows from the core of the developing system. This allows the relative humidity to build up, resulting in more intense convection and further development.
Our results also suggest that strong horizontal strain rate at middle levels, as measured by a form of the Okubo-Weiss parameter, is detrimental to tropical cyclogenesis. Not only can such flow tear apart the mid-level vortex, it can also import air with low moist entropy. In our small sample, the Okubo-Weiss parameter was the best indicator of the potential for development. Vertical shear appeared to play a less important role in the systems we investigated.
Almost 60 years ago Shigetaka Syono wrote: “In the present paper it is attempted to obtain dynamically the criterion of the formation of tropical cyclones. There exist two theories, i. e., one is a thermal theory and the other is a dynamical one. In the writer’s opinion, the two standpoints should be combined. In fact, in the present theory, the thermal instability and dynamical instability are equally important factors.” (Syono, 1953)
Though Syono’s theories about tropical cyclogenesis have been superseded, the point that cyclone formation requires consideration of both dynamics and thermodynamics is as true today as it was in 1953. This paper provides the thermodynamic counterpart to our largely dynamical study of the genesis of Typhoon Nuri (2008) (Raymond and López, 2011), hereafter RL2011. The formation of this storm was analyzed using Doppler radar and dropsonde observations. The dropsondes, many of which were deployed from an elevation of ≈ 10 km, are the key to the present study.
In spite of decades of earlier observations of mature tropical cyclones, the first projects devoted primarily to the study of tropical cyclone formation date from the early 1990s. TEXMEX (Tropical EXperiment in MEXico, 1991) documented the formation of four tropical cyclones in the tropical east Pacific. One of the most important conclusions arising from this effort is that the development of a warm core cyclone is preceded by the formation of a larger cold-core disturbance at low to middle levels, a result foreseen by Yanai (1961, 1968) using conventional meteorological data. Bister and Emanuel (1997) hypothesized that the cold core forms an environment favorable for the development of the subsequent warm core. Raymond et al. (1998) showed that circulations in developing cyclones were indeed strongest at mid-levels in their early stages in TEXMEX.
The Tropical Cyclone Motion program in the northwest Pacific (TCM-90, TCM-92, TCM-93) along with a study of the formation of south Pacific Tropical Cyclone Oliver (1993) yielded significant information on the role of mesoscale convective systems (MCSs) in tropical cyclogenesis (Harr and Elsberry, 1996; Harr et al., 1996a,b; Ritchie and Holland, 1997; Simpson et al., 1997). In these papers the importance of the interaction of mid-level mesoscale convective vortices and the downward development of a surface circulation were emphasized, though the mechanism by which downward development takes place was not convincingly specified.
In the Atlantic basin, studies of the formation of Hurricane Diana (1984) off the Florida coast (Bosart and Bartlo, 1991) led to the concept of the “vortical hot tower” or VHT (Hendricks et al., 2004; Montgomery et al., 2006) as the building block out of which the central cores of tropical cyclones are formed. VHTs are strong convective systems which further concentrate vorticity in the already vorticity-rich environment of a tropical disturbance or depression. These fossil vorticity signatures are thought to merge subsequently, forming the nascent tropical storm core. The strong convective system observed in the development of Atlantic Hurricane Ophelia (2005) (Houze et al., 2009) appeared to be an example of a VHT. The dividing line between VHTs and ordinary deep convection remains somewhat indistinct at this point.
The TPARC/TCS-08 project (THORPEX Pacific Asian Regional Campaign/Tropical Cyclone Structure experiment 2008) studied the formation, structure change, and mid-latitude transition of northwest Pacific typhoons (Elsberry and Harr, 2008). RL2011 described the facilities available in this project and presented a detailed study of the vorticity budget of developing Typhoon Nuri (2008).
Montgomery et al. (2010) demonstrated that Nuri formed out of a tropical easterly wave which originated in the central Pacific over a week before its intensification into a tropical cyclone. Following the ideas of Dunkerton et al. (2009), Montgomery et al. (2010) further showed that the core of Nuri developed near the intersection of the wave axis and a critical latitude defined as that latitude where the low-level environmental easterly wind speed matches the westward propagation speed of the wave. This intersection defines the center of a “pouch”, or a region of closed circulation in the frame of reference moving with the wave, which is protected from the intrusion of dry air from the surrounding environment. The intensification of the wave into Typhoon Nuri began as the wave moved into a region of weakening environmental shear, resulting in a deeper protected pouch. Intensification also coincided with the movement of the wave over warmer sea surface temperatures (SSTs) (RL2011).
Nuri was observed using airborne Doppler radar and dropsondes on four successive days. During these four observational periods it was categorized successively as a tropical wave, a tropical depression, a tropical storm, and a typhoon. An unusually complete picture of tropical cyclogenesis was thus obtained.
As a tropical wave, Nuri exhibited an absolute circulation around the core region nearly constant with height up to about 3 km, decreasing above this level. Thus, unlike the early-stage systems observed in TEXMEX and the TCM programs, no mid-level circulation maximum was found at this stage in Nuri. This is consistent with the picture of west Pacific waves developed by Reed and Recker (1971). The vertical mass flux profile appeared to have a maximum vertical mass flux near an elevation of 10 km. The maximum vertical gradient in the mass flux was in the range 4 - 8 km, which implies from mass continuity a maximum in mass convergence in this layer. On the following day when Nuri became a tropical depression, the circulation in this layer had increased greatly, resulting in a mid-level circulation maximum near 5 km.
As a tropical depression, the vertical mass flux profile changed markedly, with a maximum vertical mass flux at an elevation of 5 km and strongly increasing mass flux with height below this level. This was apparently responsible for the observed spinup at low levels, which was concentrated in the central core region, resulting in the formation of a tropical storm on the third day. Further intense spinup of the central region accompanied by a weaker circulation increase over a larger area resulted in the formation of a typhoon on the fourth day.
Observations from TEXMEX and the various TCM projects suggest that a strong mid-level circulation is ubiquitous in the early stages of tropical cyclone formation. As noted above, such a circulation appeared not to exist initially in the tropical wave stage of Nuri, but developed as Nuri intensified to a tropical depression. The cloud-resolving model calculations of Nolan (2007) indicate that a developing tropical cyclone forms a mid-level vortex before producing a low-level warm core, even when the simulation is initiated with a low-level circulation. These results all suggest that the formation of a robust mid-level circulation is a necessary phase of tropical cyclogenesis. This is generally called the “top-down” hypothesis of tropical cyclone formation.
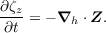
How the formation of a mid-level circulation facilitates the development of a circulation at low levels has hitherto not been determined in detail. However, it is clear from the laws of fluid dynamics that vorticity cannot be “transported downward” from middle to low levels as many papers say or imply. More precisely, the tendency of the vertical component of absolute vorticity ζz at any level can be written as the horizontal divergence of a horizontal flux of vertical vorticity Z at that level (Haynes and McIntyre, 1987), RL2011;
|
| (1) |
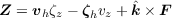
This horizontal flux is given by
 | (2) |
where vh is the horizontal velocity, ζh is the horizontal
part of the absolute vorticity, vz is the vertical velocity
appropriate to the coordinate system being used,  is a
vertical unit vector, and F is the horizontal force
per unit mass due to the turbulent momentum flux
divergence or to an external source. These equations are
exact in pressure or isentropic coordinates. In geometric
coordinates they are approximately correct in most
situations, the small error being the omission of the
vertical baroclinic generation term (see RL2011).
is a
vertical unit vector, and F is the horizontal force
per unit mass due to the turbulent momentum flux
divergence or to an external source. These equations are
exact in pressure or isentropic coordinates. In geometric
coordinates they are approximately correct in most
situations, the small error being the omission of the
vertical baroclinic generation term (see RL2011).
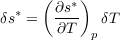
Since ∂ζz∕∂t at some level depends directly only on quantities at the same vertical level, there can be no direct transport of vertical vorticity from middle levels to low levels. However, there is an indirect effect via the second term on the right in (2), -ζhvz. This componentof the horizontal flux of vertical vorticity is equal to minus the vertical flux of horizontal vorticity, and is related to the tilting of vortex lines that occurs when this flux is horizontally inhomogeneous. One could imagine, for instance, the downward eddy flux of horizontal vorticity from a mid-level vortex to low levels. This flux could cause a localized acceleration of the flow at low levels. However, if this acceleration is limited to a finite horizontal area A, it cannot change the circulation around A. This is easily verified by horizontally integrating (1) over A and applying Stokes’ theorem, resulting in the tendency equation for the absolute circulation Γ around A:
 | (3) |
The line integrals proceed counterclockwise around
the periphery of A. The quantities vn and ζn are
the outward normal components of the horizontal
wind and vorticity at the boundary of A and Ft is
the tangential component in the counterclockwise
direction of F on this boundary. If the vertical flux
of horizontal vorticity is zero on the boundary of
A, then the second term on the right side of (3)
vanishes and its contribution to the circulation tendency
around A is zero. In other words, a bounded region of
non-zero -ζhvz produces only a vertical vorticity
dipole or a superposition of dipoles within this region.
Similar considerations apply to the flux related to the
force term  × F if Ft is zero on the boundary of
A.
× F if Ft is zero on the boundary of
A.
If the direct downward transport of vertical vorticity to low levels cannot occur, then how can a mid-level vortex spin up a low-level circulation? Equation (3) indicates that the only way the low-level spinup can occur is via the convergence of the horizontal advective flux of vertical vorticity vhζz. This convergence almost certainly has to result from convection which exhibits a rapid increase in vertical mass flux with height at low levels. As noted above, the spinup of Typhoon Nuri at low elevations was associated with convection of this type. The hypothesis that low-level spinup results primarily from low-level vorticity convergence (as opposed to the downward transport of vertical vorticity) is sometimes called the “bottom-up hypothesis”. The question then becomes how a mid-level vortex can promote convection exhibiting strong low-level, as opposed to mid-level, convergence.
The cloud-resolving model work of Raymond and Sessions (2007) provides a possible solution to this riddle. In that work, convection occurring in an environment characteristic of the undisturbed tropics (more precisely, an environment close to radiative-convective equilibrium) exhibits a maximum vertical mass flux high in the troposphere, near 9 - 10 km. Convection in a moister environment with an unaltered temperature profile produces more rainfall, but does not change the elevation of maximum vertical mass flux. However convection in an environment in which the lower troposphere is ≈ 1 K cooler and the upper troposphere ≈ 1 K warmer than the undisturbed environment produces more rainfall and also has a maximum vertical mass flux near 5 km elevation. This change in the elevation of the maximum vertical mass flux is comparable to that which occurred between the tropical wave and tropical depression stages of Nuri.
This paper explores a “unified hypothesis” which incorporates elements from both the top-down and bottom-up hypotheses. In a narrow sense there can be no dispute about the bottom-up hypothesis; as shown above, the laws of geophysical fluid dynamics preclude the downward transport of vertical vorticity in a way that increases the circulation around the system of interest at low levels. The only way this can happen is by the low-level convergence of vertical vorticity. However, this does not rule out the possibility that a mid-level vortex might alter the thermodynamic environment of convection in a manner that promotes strong low-level convergence and the corresponding spinup of a cyclonic circulation at low levels.
Bister and Emanuel (1997) proposed that the cold core in a developing cyclone promotes the formation of an embedded warm core. They assumed that the cold core arises from the cooling effects of stratiform precipitation. However, a cold core at lower levels is dynamically associated with the existence of a mid-level vortex; this may be understood either via the thermal wind relation or more compactly, from potential vorticity inversion (Davis, 1992; Raymond, 1992). A cold core supported by balanced dynamics is more likely to last long enough to produce an embedded warm core circulation than is one associated solely with evaporative cooling. Such a cold core requires a mid-level vortex with sufficient lateral size for its Rossby penetration depth to extend to the surface.
Dry air has long been thought to inhibit the strong convection associated with tropical cyclogenesis. This dry air can be imported by environmental horizontal or vertical shear, or it can be drawn into the system by the convection itself. Shear can also tear apart the fledgling cyclone vortex. Dunkerton et al. (2009) quantify the effect of horizontal shear with the Okubo-Weiss parameter, a measure of the relative importance of the rotational and strain components of the horizontal wind.
The convective import of dry air is governed by the normalized gross moist stability, which is the ratio of the lateral export of moist entropy to the lateral import of water vapor (Raymond et al., 2009). The drying effect of convection is minimized for small (or negative) values of the normalized gross moist stability. The factors controlling this parameter are therefore important for tropical cyclogenesis.
In this paper we investigate the hypothesis that dynamically balanced mid-level vortices are instrumental to tropical cyclogenesis. Section 2 develops the theoretical background for our thermodynamic analysis of tropical cyclogenesis. Section 3 covers data sources and analysis methods. The cases we studied are described in section 4 and results from areal averaging are introduced in section 5. Implications of our results are discussed and conclusions are presented in section 6.
Raymond et al. (2007) presented a theory for the development of tropical depressions. This theory is based on the idea that the low-level spinup tendency due to vorticity convergence must exceed the spindown tendency due to surface friction for a cyclone to spin up. The vorticity convergence is related to the vertical mass flux of convection and the corresponding convective rainfall rate. The rainfall rate is in turn controlled by the tropospheric humidity, or more precisely, the saturation fraction (or column relative humidity), which is the precipitable water divided by the saturated precipitable water. In this model, the time tendency of the saturation fraction thus becomes central to the evolution of a tropical disturbance; only if it increases with time will the disturbance intensify according to this theory. The time tendency of the saturation fraction is most easily approached through the budget of moist entropy.
The theory as originally developed did not incorporate the results of Raymond and Sessions (2007), i. e., the possibility that changes to the temperature profile could have a profound effect on the vertical mass flux profile and therefore the efficiency with which convection drives low-level vorticity convergence. We incorporate these ideas here.
We consider the budgets of moisture and moist
entropy inside a vertical cylinder of horizontal area
A with base at the surface and top at elevation h.
Indicating vertical integration and horizontal averaging
over this test volume by square brackets ![[]](paper35x.png) and just
horizontal averaging by an overbar
and just
horizontal averaging by an overbar  , the integrated
budgets of total cloud water mixing ratio r and specific
moist entropy s are
, the integrated
budgets of total cloud water mixing ratio r and specific
moist entropy s are
![d[ρr]+ [∇h ⋅(ρvhr)]+ ρvzr| = - R-+ Frs
dt h](paper37x.png) | (4) |
and
![d-[ρs] ---- -- --
dt + [∇h ⋅(ρvhs)]+ ρvzs|h = [ρG]+ F es +F rad](paper38x.png) | (5) |
where ρ is the density, vh is the horizontal wind, vz is the vertical wind, and ∇h is the horizontal divergence. The quantity R is the surface rainfall rate, Frs is the surface evaporation rate, G is the specific irreversible generation of entropy, Fes is the surface entropy flux due to latent and sensible heat transfer, and Frad is the vertically integrated radiative source of entropy. The third terms on the left sides of (4) and (5) represent upward fluxes out of the top of the test volume at z = h. If h is high enough, these terms vanish. They are introduced here to accommodate observations which do not extend to a high enough level to justify the neglect of these upward fluxes.
A form of the specific moist entropy which takes freezing into account (López and Raymond, 2005) is used here:
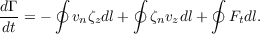
where the absolute temperature is T, the mixing ratios for water vapor, liquid, and ice are rv, rl, and ri, and pd and pv are the partial pressures of dry air and water vapor. The constant Cpd = 1005 J K-1 kg-1 is the specific heat of dry air at constant pressure, Cpv = 1850 J K-1 kg-1 is the specific heat of water vapor at constant pressure, Cl = 4218 J K-1 kg-1 is the specific heat of liquid water, Ci = 1959 J K-1 kg-1 is the approximate value of the specific heat of ice (assumed constant), TR = 273.15 K is the freezing point of water, Rd = 287.05 J K-1 kg-1 is the gas constant for dry air, Rv = 461.5 J K-1 kg-1 is the gas constant for water vapor, pR = 1000 hPa is a reference pressure, pTP = 6.1078 hPa is the triple point pressure for water, and LR = 2.5008 × 10⁶ J kg-1 and LF = 3.337 × 10⁵ J kg-1 are the latent heats of condensation and freezing at the freezing point. If ri = 0 (as we assume here), (6) reduces to the entropy equation of Emanuel (1994, p 120) if the relative humidity times the saturation vapor pressure is substituted for pv. The only difference enters for the saturated case above the freezing level, for which ice saturation is assumed in computing the saturation values of pv and rv. This results in a smaller value of saturated moist entropy than produced by the liquid-only equation. This difference is significant when computing parcel instabilities above the freezing level.The saturated moist entropy s* is obtained by setting rl = ri = 0 in (6) and replacing the vapor mixing ratio rv with its saturated value, r*. Since s* = s*(T,p), it is a surrogate variable for temperature at a given pressure level. The relationship between s* and T perturbations at fixed pressure is given by
 | (7) |
with
where r* is given in units of grams per kilogram. The quantity (∂s*∕∂T)p varies from approximately 20 J kg-1 K-2 near the surface over warm tropical oceans to near 4 J kg-1 K-2 in the upper troposphere.The normalized gross moist stability γ as discussed by Raymond et al. (2009) is proportional to the ratio of the lateral export of entropy and moisture from a test volume. A minor generalization to this definition takes into account possible vertical transports out of the top of the test volume at z = h as well:
![( ) ( )
TR- [∇h-⋅(ρvhs)]+--ρvzs|h
γ = - L [∇h ⋅(ρvhr)]+ ρvzr|h](paper312x.png) | (9) |
where we take L = LR + LF. The square brackets and the overbar have the same meaning as in (4) and (5).
Bulk flux equations are useful for obtaining approximate estimates of the surface fluxes of moisture Frs and moist entropy Fes:
 | (10) |
and
 | (11) |
where a single subscripted s indicates a value just above the surface, a subscripted ss with a superscripted asterisk indicates a saturated value at the sea surface temperature and pressure, CD ≈ 10-3 is the surface exchange coefficient, and Uebl = (Ubl2 + Wbl2)1∕2 is an effective boundary layer wind in which Ubl is the actual, earth-relative surface wind speed, and Wbl ≈ 3 m s-1 is a gustiness correction (Miller et al., 1992). For consistency with the results of RL2011, the exchange coefficient used in this paper for momentum is also used here for thermodynamic fluxes:
 | (12) |
The radiative part of the entropy source is
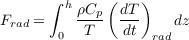 | (13) |
where T is the absolute temperature, Cp is the specific heat of air at constant pressure, and (dT∕dt)rad is the net radiative heating rate as a function of height.
The test volume is generally considered to move with the disturbance of interest. The velocity vh is therefore considered to be disturbance-relative. The irreversible entropy source G (the most important component of which is diffusion of moisture according to Pauluis and Held, 2002) is ignored here, which introduces an error. In principle the entropy could be replaced by the moist static energy, but this variable is only approximately conserved by moist adiabatic processes, introducing a corresponding error, so there is no clearly favored choice of conserved thermodynamic variable. López and Raymond (2005) found that these errors are small and often of opposite sign for the moist entropy and the moist static energy and in many circumstances the results do not depend on which is used.
Equation (4) is useful for estimating the rainfall rate if the time tendency term is ignored. This assumption should be at least approximately valid if the area A is large enough to encompass many convective elements in different phases of their life cycle. If this assumption is valid, then the rainfall rate can be estimated as
![-- -- ----
R = F rs - [∇h ⋅(ρvhr)]- ρvzr|h .](paper317x.png) | (14) |
The time tendency of the volume-integrated moist entropy can be written as
where (9) and (14) have been invoked and where irreversible generation of entropy is ignored. Thus, increasing surface entropy fluxes and decreasing radiative losses increase the vertically integrated moist entropy, while increased net rainfall R -Frs decreases the moist entropy as long as the normalized gross moist stability γ > 0. Small or negative values of γ thus favor increases in the integrated moist entropy for positive net rainfall.The saturation fraction, which equals the precipitable water W divided by the saturated precipitable water Ws, plays an important role in determining the precipitation rate according to recent results. Since the specific moist entropy is given approximately by the equation s ≈ sd + Lrv∕TR where sd is the specific dry entropy, L is the latent heat of condensation, rv is the water vapor mixing ratio, and TR is a constant reference temperature, the saturation fraction can be approximated as
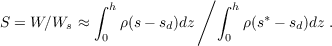 | (16) |
Based on a series of cloud-resolving model calculations as well as observational results, Raymond et al. (2007) proposed that the rainfall rate R in millimeters per day over warm tropical oceans is related to the saturation fraction of the troposphere S by the equation
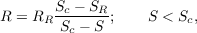 | (17) |
with an assumed radiative-convective equilibrium rainfall rate RR = 4 mm d-1, a saturation fraction corresponding to radiative-convective equilibrium SR = 0.81, and a critical saturation fraction Sc = 0.87.
An alternative relationship between rainfall rate and saturation fraction was obtained from satellite passive microwave observations of rainfall and precipitable water by Bretherton et al. (2004). In our terminology their result is
![R = exp [A (S - B )]](paper321x.png) | (18) |
where A = 11.4, B = 0.522, and R is in millimeters per day.
Though the saturation fraction appears to explain the largest part of the variability in the rainfall, other factors may be important as well, e. g., the surface wind speed (Back and Bretherton, 2005) and the tropospheric temperature profile (Raymond and Sessions, 2007). Dropsonde observations in developing tropical storms provide a further opportunity to test these results by comparing the rainfall predicted by (14) and (17).
Another piece of the puzzle of tropical cyclogenesis is
to obtain a relation between vorticity convergence and
rainfall rate. Equation (14) shows that there is a
strong relationship between rainfall and moisture
convergence. As Raymond et al. (2007) point out,
moisture convergence is tightly coupled to low-level mass
convergence since water vapor is concentrated in the
lower troposphere. Similarly, vorticity convergence is
related to mass convergence. Thus, there should be a
relationship between moisture convergence and low-level
vorticity convergence. We hypothesize that the boundary
layer vorticity convergence -∇h ⋅ (vhζz)bl scaled by the
average boundary layer vorticity ζz is proportional to
the moisture convergence -![[∇h ⋅(ρvhr)]](paper322x.png) scaled by
the average precipitable water W over the analyzed
region,
scaled by
the average precipitable water W over the analyzed
region,
![----------
-∇h--⋅(vhζz)bl= - C [∇h-⋅(ρvhr)],
ζz W](paper323x.png) | (19) |
where C is the dimensionless constant of proportionality. The vorticity scaling comes from the fact that the vorticity tendency scales as the product of the mass convergence and the vorticity. Similarly, the moisture convergence is likely to scale with the product of the mass convergence and the precipitable water.
Vertical shear of the horizontal wind and horizontal flow deformation are two processes which can lead to dry environmental air penetrating the core of a pre-cyclone disturbance (Dunkerton et al., 2009; Montgomery et al., 2010), RL2011. Both of these processes disrupt the closed circulation which is thought to promote the increase in humidity and rainfall which we hypothesize to be needed for spinup. A measure of the effect of horizontal flow deformation is the Okubo-Weiss parameter (Dunkerton et al., 2009; Montgomery et al., 2010), which is defined by them as
 | (20) |
where
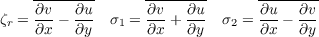 | (21) |
with (u,v) being the horizontal wind. This is in the form of the square of the relative vorticity minus the squares of two components of the strain rate. Large positive values indicate the dominance of rotation over strain and are associated with closed circulations. Such circulations are inhibited by small or negative values of O. The Okubo-Weiss parameter is thus another indicator of the potential for cyclone intensification.
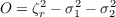
We further define a normalized Okubo-Weiss parameter as follows:
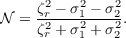 | (22) |
This parameter equals 1 when the flow is completely rotational, -1 when it is completely strained, and zero for unidirectional shear flow. The advantage over the traditional Okubo-Weiss parameter is that it evaluates the relative magnitudes of the rotational and strain components of the flow irrespective of their absolute values. For purposes of evaluating the tendency of strainto disrupt a rotational flow, the normalized Okubo-Weiss parameter would appear to be more informative than the traditional version.
Horizontal and vertical averaging is done over O and
 . More precisely, we average ζr, σ1, and σ2 and then
calculate O and . This is done to emphasize robust,
system-wide characteristics rather than small-scale
fluctuations.
. More precisely, we average ζr, σ1, and σ2 and then
calculate O and . This is done to emphasize robust,
system-wide characteristics rather than small-scale
fluctuations.
The data used in this paper were obtained during the TPARC/TCS-08 project in August and September of 2008. See RL2011 for a description of this project, including the facilities used and their locations.
Dropsondes were launched from both WC-130J aircraft flying near an elevation of 10 km and the NRL P-3 aircraft flying mostly in the elevation range 2-4 km. The P-3 also carried the ELDORA X-band Doppler radar. The WC-130J aircraft deployed dropsondes on a regular grid with dimensions of order 5∘ and dropsonde spacing near 1∘. The P-3 sought out convection in a survey mode, covering as much area as possible in the region observed by the WC-130J.
Dropsondes were subjected to quality control by the Earth Observing Laboratory (EOL) of the National Center for Atmospheric Research. We subsequently inspected each sonde and discarded those with large (generally exceeding 100 hPa) data gaps, missing winds, or other flaws. No further corrections were made. The remaining quality controlled sondes were then linearly interpolated to a 25 m height grid. Analyzed fields were temperature, mixing ratio, pressure, height, and two derived fields, the specific moist entropy and the saturated specific moist entropy. The geopotential height field derived from the hydrostatic equation applied to the pressure, temperature, and humidity fields was used for the height. The EOL analysis adjusted the height so that it was either zero at the surface or equal to the aircraft altitude at launch, depending on whether the sonde transmitted data all the way to the surface.
Data were interpolated to a three-dimensional grid as part of a 3D-VAR wind analysis. Dropsonde horizontal winds and Doppler radar radial velocities were used in the analysis. Mass continuity was strictly enforced by the use of a strong penalty function in the 3D-VAR scheme and subjectively adjusted smoothing parameters in the horizontal and vertical were used to eliminate variance on scales unsupported by the spacing of dropsondes. The analysis was performed in a reference frame moving with the disturbance of interest to minimize errors introduced by the differing times of dropsonde launches and radar observations. The reference time is the time at which the position of the disturbance in the earth frame coincides with its position in the co-moving frame. Details of the data analysis scheme are presented by RL2011.
3D-VAR analyses were made on the dropsonde thermodynamic data for the same grid using a technique similar to that used for the wind calculations. A weighted average of all data points within a volume of influence associated with each grid point g was computed:
 | (23) |
where Fd(k) are the data values and the weighting factor is defined w(k) = dk-2 with dk being the distance between the grid point and the kth data point. A longitude-latitude-height grid was used with grid spacings (Δλ,Δϕ,Δz). The domain of influence for a particular grid point (λ,ϕ,z) is the rectangular volume defined by (λ ± Δλ,ϕ ± Δϕ,z ± Δz). The grid cell dimensions of Δλ = Δϕ = 0.125∘ and Δz = 625 m match the wind analysis grid.
The same conjugate gradient software used by RL2011 was employed to minimize the global target function
![T (F ) = ∑ [(F - F )2 + P (F)+ P (F )]
G g λ ϕ](paper328x.png) | (24) |
by varying F, the gridded field, where F - Fg is the difference between the gridded value of a variable F and the weighted average of the observations for that variable defined in (23). If no data existed at a particular grid point, the term (F - Fg)2 for that grid point was omitted from the sum G over all the grid points.
The terms Pλ(F) and Pϕ(F) are centered smoothing operators in the longitudinal and latitudinal directions:
![2
Pλ(F) = Y [F (λ - Δλ) + F(λ+ Δ λ)- 2F(λ)]](paper329x.png) | (25) |
![2
Pϕ(F ) = Y [F(ϕ- Δ ϕ)+ F (ϕ + Δϕ )- 2F(ϕ)].](paper330x.png) | (26) |
The smoothing weight was set to Y = 0.1 in our case. On the lateral boundaries the same filter was used, but with off-center differencing toward the interior of the grid. No smoothing was done in the vertical direction.
In order to reduce artifacts in the analysis which occur if a sounding begins or ends within the gridded region, all variables had mean profiles subtracted before the global fit. These mean profiles were calculated as averages over all of the soundings used in the analysis for a particular mission, including soundings from both the WC-130J and P-3 aircraft. After the analysis the mean profiles were added back in. Similar artifacts due to dropsondes moving from one latitude-longitude grid box to another under the influence of horizontal winds were eliminated by using the drop-averaged longitude and latitude for each sonde in the analysis, thus confining the data from each sonde to a single column in the analyzed grid. Given typical winds and size of the analyzed area, this introduced only small errors. In order to match the wind analysis, sonde locations were corrected to the same reference time used in that analysis, with the same assumed system propagation velocity.
After the thermodynamic analysis was done, it was merged with the wind analysis. The combined analysis was then masked to remove points outside the region covered by the dropsondes. Data above 10 km were also eliminated since dropsonde data did not exist above this altitude. Finally a variety of auxiliary variables were computed.
Further subjective masking was then done to limit calculations to regions with high saturation fractions and significant positive vorticity in the 3-5 km layer. These analysis regions are indicated by the red polygons in the lower left panels of figures 1-7.
Surface thermodynamic fluxes were obtained using Reynolds SSTs (Reynolds and Marsico, 1993). Though these SST estimates are not as good as others of higher spatial and temporal resolution, they are considerably better than climatology, are readily available, and should be adequate for estimating surface fluxes.
Seven missions, consisting of simultaneous flights of the NRL P-3 and a WC-130J aircraft, were flown from Guam on five different systems, as detailed in table 1. The precursor to Typhoon Nuri was observed on two successive days, with missions labeled Nuri1 and Nuri2. Two missions were also flown on TCS-025, labeled TCS-025-1 and TCS-025-2. The precursor to Typhoon Hagupit was observed on two days, but only the second of these missions, labeled Hagupit2, is used here, as the first mission lacked suitable dropsonde data. The remaining cases, TCS-030 and TCS037, were observed just once.
The propagation velocities listed in table 1 are generally based on vorticity patterns from the National Centers for Environmental Prediction final analysis (FNL). These velocities tend to jump around during the early stages of a disturbance. They also may differ from the wave propagation speed. Montgomery et al. (2010) obtain a westward wave propagation speed for Nuri1 close to 7 m s-1 based on a different type of analysis, orabout 2 m s-1 faster than assumed in RL2011. We use the faster propagation speed of Montgomery et al. (2010) for the analysis of Nuri1 in this paper, as overall this value seems to be more consistent with the observed wave motion as opposed to the motion of vorticity elements.
Of the five systems studied, Nuri and possibly TCS037 were caught in the act of intensifying. TCS037 appeared from satellite imagery to become a small, unnamed tropical storm near northern Japan a few days after our observations. Our measurements on Pre-Typhoon Hagupit occurred nearly a week before this system began to amplify and no signs of intensification were evident in our analysis. TCS025 and TCS030 did not intensify into tropical cyclones, though TCS025 showed signs of doing so. TCS030 was a weak, low-latitude tropical wave which serves as a baseline with nearly undisturbed tropical conditions.
Regions analyzed are indicated by the red polygons in the lower left panels of figures 1-7. High saturation fraction, the existence of significant positive vorticity, and system-wide organization of the circulation (if such organization exists) were used in a subjective manner to define these regions. Selection of the region analyzed is a weak point of control volume studies such as this. As more case studies are obtained, it may be possible to develop more objective criteria for region selection.
We now describe the individual characteristics of each case in more detail.
As a weak tropical wave showing no tendency to intensify, TCS030 is the closest we have to a “null” case. Ultimately it made landfall in the Philippines. As the mission plot figure 1 shows, the saturation fraction did not exceed S = 0.85 in this system and mostly took on much smaller values. The system-relative mid-level wind (average over the height range 3 - 5 km) showed no organized circulation and the vorticity pattern was scattered with mainly small scale organization. The wind shear in TCS030 was from the northeast. The most extensive convection occurred in the northwestern part of the observed region. The sub-region selected for further analysis (indicated by the red polygon in the lower left panel of figure 1) excludes the southern and eastern parts of the area spanned by WC-130J dropsondes, as this area was poorly observed both by dropsondes and Doppler radar. TCS030 provides a useful null case relative to the other cases examined, all of which showed some organization and potential for intensification. The thermodynamic sounding (expressed in terms of profiles of moist entropy and saturated moist entropy) is compared with soundings in other cases.
Two missions into developing Typhoon Nuri (Nuri1 and Nuri2) captured the transition of this disturbance from a tropical wave to a tropical depression. Nuri subsequently developed into a typhoon, as described by Montgomery et al. (2010) and RL2011.
The mission plot for Nuri 1, figure 2, shows that the area of high saturation fraction in Nuri1 was somewhat larger than that in TCS030, with higher maximum values. The average moist entropy and saturated entropy profiles shown in the upper right panel of figure 2 indicate that this increase in saturation fraction resulted from a combination of decreased moist entropy and saturated moist entropy at low to middle levels and increased moist entropy at upper levels.
The wind shear for Nuri1 was from the north-northeast, with most of the shear occurring below 5 km. During the Nuri1 mission we noted visually that the system had a structure somewhat resembling a westward-moving squall line, with new convection developing on the west side and dissipating into stratiform cloudiness on the east side. The system as a whole appeared to be moving faster to the west than the component convective cells, which is consistent with the relative eastward movement through the system of evolving cells. The reflectivity pattern and the vorticity structure seen in the lower left panel of figure 2 are consistent with this picture; high reflectivities occur mostly to the west and the horizontal scale of vorticity perturbations increases to the east.
Nuri1 exhibited a cyclonic circulation at mid-levels, as the upper left panel in figure 2 shows. An even stronger surface circulation also existed (not shown; see RL2011) with a circulation center displaced about 3∘ to the west-northwest of the mid-level circulation. The observed region was well centered on the Nuri1 circulation and virtually all of this region, as indicated by the red polygon in the lower left panel of figure 2, was used for the analysis.
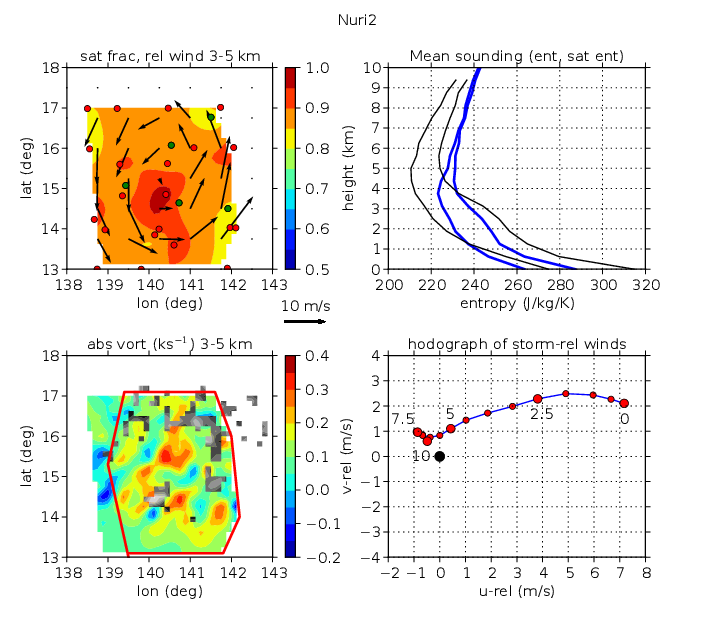
Figure 3 shows the mission plot for Nuri2. Several things are immediately evident. Saturation fraction values are much higher in Nuri2 than in Nuri1, with some values exceeding 0.95. The mid-level circulation is stronger than Nuri1 and more symmetric, with the maximum saturation fraction occurring at the center of the circulation at this level. The vorticity values are larger on the average than for Nuri1 and the mid-level vorticity pattern is better organized, though still not concentrated in the center of the circulation. The mean soundings show that saturated moist entropy continued to decrease in the lower troposphere and increase in the upper troposphere. Furthermore, the moist entropy increased significantly above 1.5 km. In short, Nuri intensified significantly.
The wind shear shifted to easterly in Nuri2, but had about the same magnitude as in Nuri1. Little shear occurred above 5 km. The low level center was still not aligned with the mid-level center, but was located about 2∘ to the north (see RL2011). The convective system near (140.2E, 15.4N) was isolated, but it was quite large and highly rotational according to a high resolution analysis not shown here, and may be an example of a vortical hot tower.
The area selected for further analysis of Nuri2 omits the western periphery of the disturbance. This region, though still quite moist, was dominated by downdrafts and lacked significant positive vorticity. This may be a dynamical effect associated with the shear and the associated storm-relative flow at low levels.
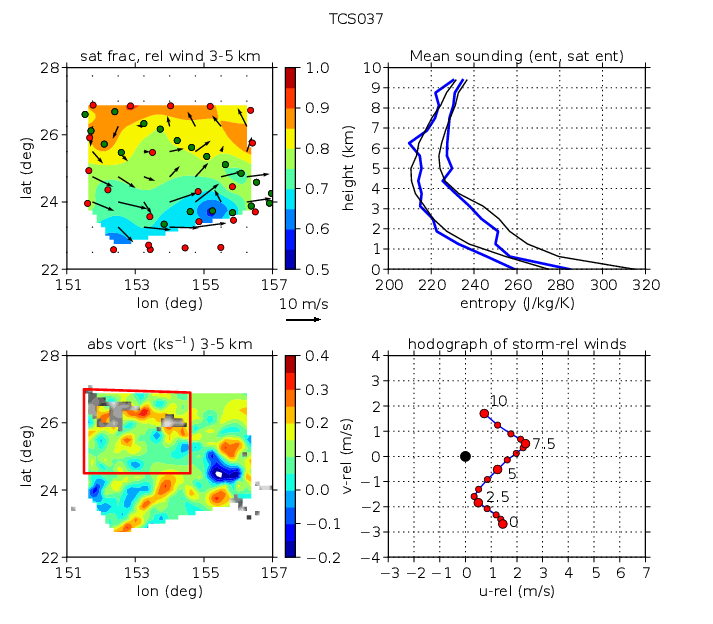
TCS037 developed on the northeast side of a tropical upper tropospheric trough (TUTT). The TUTT cell may have provided some background vorticity, but was extremely dry in its core. The mission plot, figure 4, shows the extreme north-south gradient in saturation fraction on the south side of the disturbance-related circulation.
Figure 4 also shows a strong cold anomaly below 3 km elevation, as indicated by the low values of saturated moist entropy relative to TCS030. The moist entropy is also somewhat decreased below this level. Above 3 km the sounding is almost identical to that of TCS030 in spite of the higher latitude and the ≈ 2 K cooler SST.
Wind shear was southerly in this system and apparently weaker and more distributed in the vertical than for Nuri. The wind profile must be interpreted with caution, as the observed area was not centered on the mid-level circulation center. Cancellation via averaging of the axially symmetric part of the system-related flow thus did not occur, resulting in strong contamination of the environmental wind profile by system winds.
The mid-level vorticity was quite well organized, with a circulation intermediate in strength between Nuri1 and Nuri2, but significant convection was limited to the northwest corner of the observed region. Though substantial vorticity occurred in the southern part of the observed domain, this region was considered to be convectively inactive due to the low humidity. The mid-level circulation was also less organized on the east side of the observed area. The analyzed region is therefore confined to the north of 24.5∘ N and to the west of 154.6∘ E.
TCS025 was observed on two successive days to the northeast of Guam. Though initially promising, it remained disorganized as it moved slowly to the northeast and it did not intensify into a tropical storm.
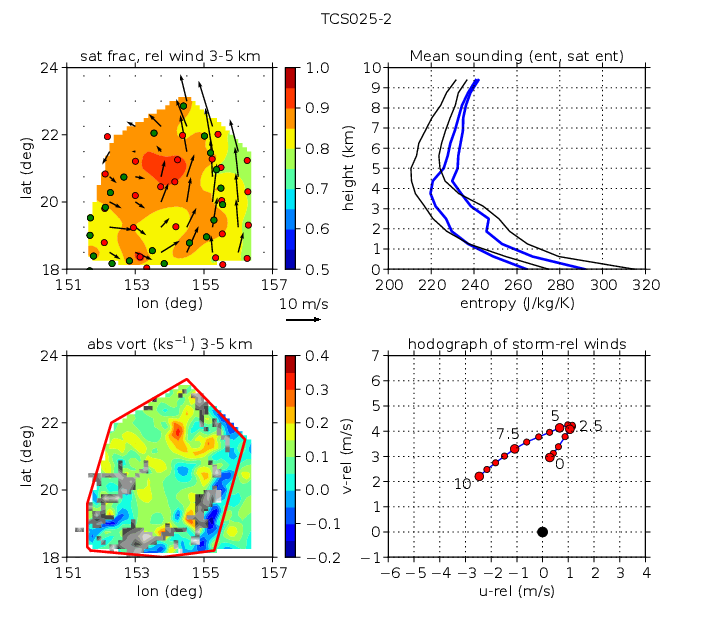
Figures 5 and 6 show the mission plots for TCS025-1 and TCS025-2. Peak values of saturation fraction exceeded 0.9 on both days and saturated moist entropy soundings were significantly cooler than TCS030 in the lower troposphere and warmer in the upper troposphere. However, the saturated moist entropy anomaly decreased in magnitude from the first day to the second. The mid-level vorticity anomaly became less intense and more widespread from TCS025-1 to TCS025-2 and the overall mid-level circulation increased somewhat. Significant convection occurred away from the circulation center on both days.
The wind shear was from the northeast on both days and was slightly stronger on the first day (TCS025-1). On the second day (TCS025-2) the shear was variable in direction at low levels. As with TCS037, the mid-level circulation center was located at or near the edge of the observed area on both days, so the wind profiles must be interpreted with caution. The southern part of TCS025-1 contained higher humidities and vorticities, so the analysis region was restricted to south of 20∘ N. For TCS025-2 nearly the entire observed area was included in the analysis, excluding only a small part with drier air on the southeast side.
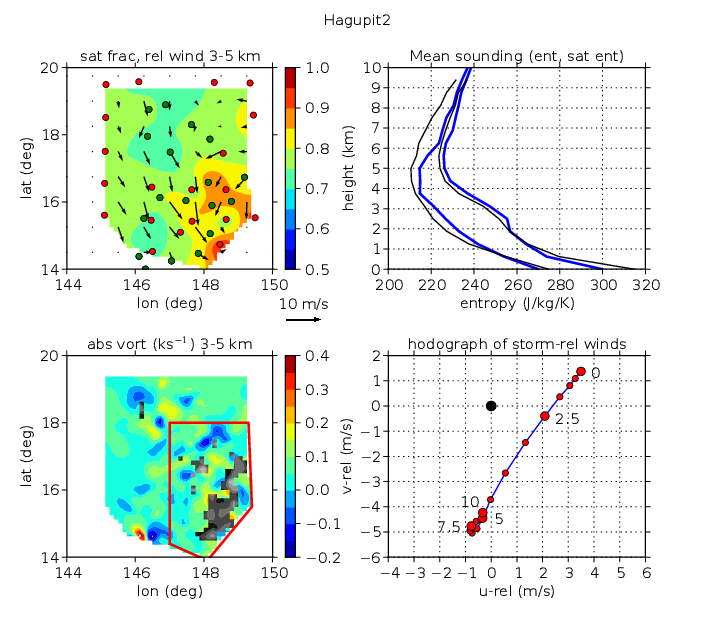
The precursor disturbance to typhoon Hagupit was observed on two successive days. However, high-level dropsondes were available only on the second day’s mission, so we limit our discussion to that mission, which we denote Hagupit2. This disturbance was weak and disorganized during our observations and remained that way for several days afterward. It finally intensified into a tropical storm roughly 6 days after our observations ended.
Figure 7 shows the mission plot for Hagupit2. Higher saturation fractions are confined to the southeast corner of the observed area and there is a hint of a weak closed circulation center just outside of this area to the southeast. However, the circulation is far from axially symmetric. The saturated moist entropy perturbations in the mean sounding are weak relative to TCS030 and the moist entropy profile is drier than TCS030 above 1 km. Hagupit2 exhibited shear from the northeast in the lower half of the troposphere with little shear above the mid-troposphere. Overall, pre-Hagupit was quite weak at the stage at which we observed it, closer to TCS030 in character than to the other observed disturbances. However, high humidities associated with significant convection and stratiform cloudiness existed in the southeast quadrant of the observed area. The analyzed region was confined to this quadrant, as illustrated in figure 7.
We now present analyses of area-averaged results for our five cases. These results are summarized in figures 8-11 and in table 2. Horizontal averaging was done over regions enclosed by the red polygons in the lower left panels of figures 1-7. The low-level vorticity and vorticity tendency in table 2 are averages over the height range 0 - 1 km while the mid-level vorticity, vorticity tendency, and normalized Okubo-Weiss parameter are averaged over 3 - 5 km. The saturation fraction, normalized gross moist stability, and column entropy tendency are computed over the height range 0 - 9.375 km. The wind shear is the magnitude of the difference between the vector winds in the 0 - 1 km and 3 - 5 km layers. The rainfall rates are estimated from the moisture equation (14) with the time tendency of moisture omitted. This can be a significant source of error and is probably why the rainfall estimate for TCS030 is slightly negative.
In this section we consider the vorticity dynamics of the five tropical disturbances discussed above. Figure 8 shows the absolute vorticity and vertical mass flux profiles for the seven missions, averaged over the regions outlined in red in the lower left panels of figures 1-7. The vertical mass flux is defined as the density times the vertical velocity:
 | (27) |
The two disturbances for which we have multiple missions, Nuri and TCS025, form an interesting contrast. The mean vorticity in Nuri increased at all levels between the missions, most dramatically near 5 km. As noted by RL2011, the mean vorticity in Nuri1 was nearly constant up to about 3 km and decreased above this level. The vorticity at the surface in Nuri2 increased only slightly over that of Nuri1. However the mean vorticity at 5 km nearly doubled over the 24 hr separating the two missions.
Examination of the vertical mass flux profiles of Nuri1 and Nuri2 in figure 8 gives a hint as to why the biggest vorticity increase occurred at mid-levels. The mass flux profile in Nuri1 is top-heavy, with the greatest increase in mean mass flux with height occurring in the middle troposphere. By mass continuity, the strongest lateral inflows therefore occurred in the middle troposphere. To the extent that mass convergence is related to vorticity convergence, this implies spinup via the vorticity convergence term of the vorticity equation (1). This result is confirmed by figure 9, which shows the horizontally averaged vertical profiles of vorticity tendency for Nuri and the other observed cases.
With the development of a stronger mid-level circulation, the cold core at low levels was significantly enhanced in Nuri2 compared to Nuri1, as indicated by the change in the vertical profile of saturated moist entropy between the two cases in figures 2 and 3. This enhancement of the cold core was associated with a dramatic change in the vertical mass flux profile between Nuri1 and Nuri2. Figure 8 shows that the level of maximum vertical mass flux decreased in elevation from roughly 10 km to about 5 km. As a result of this, the vorticity tendency due to convergence in Nuri2 developed a strong low-level maximum, far exceeding the spindown tendency due to friction, as noted by RL2011.
TCS025 underwent a somewhat similar evolution to Nuri during the two days over which we observed it. As figure 8 shows, this system developed a similar mid-level vorticity maximum on the second mission into this system (TCS025-2), compared to the vorticity profile observed on the first mission (TCS025-1). However, the enhancement of the overall vorticity pattern was weaker than in Nuri and the mean vorticity at the surface actually decreased.
The vertical profile of mass flux in TCS025-1 shows a top-heavy profile which is consistent with the vorticity tendency profile due to convergence for this mission shown in figure 9. The vertical mass flux profile in TCS025-2 is much more bottom-heavy than in TCS025-1. TCS025-2 exhibited a maximum in the convergence component of the vorticity tendency at the surface, as seen in figure 9. However, this tendency is weaker than that seen in Nuri2.
Overall, Nuri and TCS025 showed significant similarities in their paths of development. However, Nuri was stronger and better organized and developed into a typhoon, whereas TCS025 did not intensify.
We now examine three other cases, TCS037, Hagupit, and TCS030. TCS037 exhibited a strong mid-level circulation on the day we examined it, with only slightly weaker vorticity near the surface. It had a significant cold core at low levels according to the mean sounding shown in figure 4, and the mass flux profile for TCS037 in figure 8 is comparable below 5 km to that seen in Nuri2. However, the net vorticity tendency for TCS037 shown in figure 9 is slightly negative at the surface.
Hagupit, which become a typhoon approximately a week after we observed it, was in a very early stage of development. Little or no cold core at low levels was evident in figure 7 and the vertical mass flux profile shown in figure 8 was very top-heavy, with a maximum mass flux near 9 km. The vorticity profile had maximum vorticity at the surface. Not surprisingly, the maximum vorticity tendency seen in figure 9 for Hagupit2 occurs in the middle to upper troposphere, suggesting that Hagupit was beginning to form a mid-level vortex.
TCS030 had a very weak vorticity profile with a maximum at the surface. The vertical mass flux profile was also very weak and top-heavy. The vorticity tendency profile was also quite weak (not shown; see RL2011). As noted above, this system showed no tendency to develop.
Reed and Recker (1971) showed that west Pacific tropical waves exhibit maximum vorticity at low levels, unlike African easterly waves, which tend to have a prominent vorticity maximum near 700 hPa (Jenkins and Cho, 1991). Our observations confirm this result for non-developing disturbances and those in an early stage of development, e. g., TCS030, Nuri1, and Hagupit2. On the other hand, disturbances which are intensifying or have previously intensified to a certain degree, such as Nuri2, TCS025-2, and TCS037, tend to have strong vorticity near 500 hPa, or even a maximum in the vorticity profile at this level. Our results suggest that this mid-level vorticity maximum and the associated cold core at low levels result in a more bottom-heavy vertical mass flux profile than would otherwise occur. A bottom-heavy profile is associated via mass continuity with strong inflow at low levels, which can lead to the subsequent spinup of a low-level, warm-core vortex. The production of a mid-level vortex is similarly associated with a top-heavy vertical mass flux profile with strong mid-level inflow. Thus, in this picture the initial impetus for tropical cyclogenesis in the northwestern Pacific ocean is a strong episode of convection with a top-heavy mass flux profile, which results in the development of a cold-core, mid-level vortex. This is then followed by the development of convection with a bottom-heavy mass flux profile, resulting in the spinup of a low-level, warm-core vortex.
The upper left panel of figure 10 shows a scatter plot of the average rainfall rate versus saturation fraction for the systems presented in table 2. As expected from previous results (Raymond and Sessions, 2007), there is a correlation between these two quantities. However, the correlation is imperfect. This is likely due to the stochastic nature of convection, which is known to result in episodic convective bursts and lulls, and thus adding noise to any deterministic relationship between precipitation and other variables (Xu et al., 1992).
The blue line in this plot represents the relationship (17) between rain and saturation fraction hypothesized by Raymond et al. (2007). This is not a particularly good fit to the data, with the asymptote to large rainfall occurring for too large a value of saturation fraction. The green line represents the fit to satellite microwave data calculated by Bretherton et al. (2004). The precipitation increases too slowly with saturation fraction in this curve.
Raymond and Sessions (2007) found a correlation between stabilization of the tropospheric temperature profile and an increase in the precipitation rate. The modified profile consists of a warm anomaly in the upper troposphere and a cool anomaly in the lower troposphere. We quantify the tropospheric stability by an “instability index”, defined as the difference between the average saturated moist entropy in two layers, the lower being 1 - 3 km, the upper being 5 - 7 km:
 | (28) |
Larger Δs* corresponds to greater instability, but only if the environment is saturated. More importantly, larger values of Δs* promote larger negative buoyancies in downdrafts driven by the evaporation of rain, and thus favor stronger downdrafts. The saturated moist entropy, a function only of the temperature and pressure, is used instead of the temperature itself since moist static instability is directly proportional to the vertical gradient of saturated moist entropy in a saturated environment. Values of Δs* can be converted to temperature perturbations using (8).
As figures 2-7 indicate, all disturbances with the exception of Hagupit2 show a cooler lower troposphere than the null case TCS030. The upper troposphere is warmer in all cases except Hagupit2 and TCS037. These anomalies correspond to smaller values of Δs*. The upper right panel of figure 10 shows that Δs* is weakly anti-correlated with rainfall rate. However, as the lower right panel of figure 10 shows, the saturation fraction and the instability index are themselves strongly anti-correlated, so it is impossible to separate the effects of saturation fraction and instability index on rainfall rate using this data set.
Rainfall has been shown to correlate with surface total heat (or moist entropy) flux in a number of contexts over tropical oceans (Raymond, 1995; Raymond et al., 2003; Maloney and Sobel, 2004; Sobel et al., 2009). The lower left panel of figure 10 shows almost no correlation between rain and surface moist entropy flux in these cases.
Correlation does not imply causality, and one might reasonably hypothesize that the correlation between rainfall and saturation fraction occurs because heavy rainfall itself causes high saturation fraction and low instability index. However, the evidence leans toward the alternate interpretation that rainfall is a result of these factors rather than a cause. In particular, if the normalized gross moist stability is positive, which is the usual case, then convective precipitation tends to reduce rather than increase the precipitable water, and hence the saturation fraction, as (15) demonstrates. Sherwood (1999) showed that lower tropospheric moistening actually leads enhanced precipitation in the western tropical Pacific, suggesting that the former caused the latter. Cloud resolving model simulations also suggest that the convective precipitation rate is highly sensitive to the saturation fraction of the environment in which convection is embedded (Raymond and Zeng, 2005).
The transient convective response to convection is an “onion sounding” (Zipser, 1977) which exhibits lower temperatures in a thin layer near the surface, but a warmer, drier environment through most of the lower troposphere, corresponding to a larger instability index. (This does not mean greater actual instability, because the typical onion sounding is far from being saturated.) However, in the longer term, the temperature profile tends to revert to that profile favored by balanced dynamics as manifested in the thermal wind equation, as we now discuss.
The thermal wind equation (or potential vorticity inversion) predicts that a mid-level vortex should be associated with a warm anomaly above the vortex and a cool anomaly below it. The vertical extent of these anomalies scales with the Rossby penetration depth associated with the vortex. Thus, there should be a strong anti-correlation between the instability index Δs* and the mid-level vorticity for a sufficiently robust vortex. The upper left panel of figure 11 confirms the existence of this anti-correlation. Since rainfall rate and instability index are themselves anti-correlated, we also expect a correlation between rainfall rate and mid-level vorticity, a result which is verified in the upper right panel of figure 11.
Raymond et al. (2007) hypothesized that strong correlations should exist between rainfall, low-level convergence, and the tendency of a cyclone to spin up. This is discussed in section 2. The correlation between rainfall and low-level mass convergence follows from the moisture budget equation (14) since the mixing ratio is highest at low levels and drops off rapidly with height. This makes mass convergence at low levels the most effective form for converging moisture. Low-level mass convergence also promotes low-level vorticity convergence, which is the key to developing the low-level warm core of a cyclone. The low-level vorticity tendency is indeed correlated with the moisture convergence as shown in the middle left panel of figure 11. The scaling of these two quantities is defined in (19) and a least-squares fit yields the constant of proportionality to be C = 1.05.
Finally, the middle right panel of figure 11 shows a correlation between mid-level vorticity and the low-level vorticity tendency, as would be expected from the relationships between mid-level vorticity, instability index, rainfall rate, and vorticity convergence.
To summarize, the above chain of logic shows how a sufficiently large and strong mid-level vortex can cause a low-level vortex to spin up. This spinup does not occur via the direct downward extension of the mid-level vortex to the surface in this picture; rather, it is a consequence of the response of the convection to the balanced, low-level cold core dynamically associated with the mid-level vortex. This cold core results in convection with a bottom-heavy mass flux profile, which is very efficient at producing rainfall and which generates the strong, low-level vorticity convergence needed for the spinup of a low-level, warm core vortex. The evidence we present is highly suggestive that this process occurs in developing tropical cyclones.
The low-level vorticity tendency indicates how the circulation is developing at the time of the observation. However, the column-integrated entropy tendency is closely related to the time tendency of saturation fraction and hence future rainfall, and as such is a potentially strong predictor of near-future development. As (15) shows, the entropy tendency is equal to the sum of three contributions, the partial tendencies due to upward surface and tropopause entropy fluxes and the tendency due to the lateral entropy flux out of the volume of interest. The last contribution equals minus the normalized gross moist stability γ times the net rainfall rate. In the absence of vertical entropy flux divergences, negative γ is thus needed to realize a positive entropy tendency. However, if the surface flux exceeds the tropopause flux, a positive entropy tendency can occur if γ is positive but small.
Concentration of the lateral inflow at low levels where the environmental moist entropy is large favors negative, or at least smaller positive values of γ (assuming positive net rainfall), and hence a positive column entropy tendency. This concentration of the inflow at low levels is associated with bottom-heavy convective mass flux profiles, which is precisely the situation in which a positive low-level vorticity tendency occurs. Thus, bottom-heavy convective mass flux profiles would appear to play a dual role in tropical cyclogenesis, by encouraging current spinup and by facilitating the high humidity conditions favorable to future spinup.
Nuri1, Nuri2, and TCS037 exhibited positive column entropy tendencies according to table 2; tendencies were negative for all other cases. Of these missions Nuri2 and TCS037 had near-zero normalized gross moist stability according to our calculations. Nuri intensified into a major typhoon shortly after the Nuri2 mission and TCS037 most likely developed into a small tropical storm a few days after we observed it. None of our other cases developed into a tropical cyclone except Hagupit. However, Hagupit’s intensification occurred nearly a week after our observations. Thus, the column entropy tendency appears to have some skill in predicting intensification of a tropical disturbance and cyclogenesis in a day or two following the observation.
Deep convection over tropical oceans has a significant diurnal cycle, with a convective maximum in the early morning (Yang and Slingo, 2001). All of our observations took place during the day, close to the minimum in the diurnal cycle. It is likely that column entropy tendency exhibits a related diurnal cycle, possibly biasing our results toward more negative values than the true diurnal mean, which averaged over the missions should be close to zero, given the variety of different scenarios.
The difference between intensifying and non-intensifying
systems stands out in the mid-level, normalized
Okubo-Weiss parameter as well as in the entropy
tendency. The values of exceeded 0.8 for Nuri1,
Nuri2, and TCS037 and were less than 0.7 for all
non-intensifying disturbances.
The lower left panel of figure 11 shows a strong
correlation between the column entropy tendency
and . Since involves the mid-level vorticity,
one might expect a correlation to exist between the
mid-level vorticity and . The lower right panel of
figure 11 shows that this correlation exists, but is not
strong. The correlation between entropy tendency and
mid-level vorticity (not shown) is actually weaker
than between entropy tendency and , suggesting
that a positive entropy tendency is more closely
related to weak horizontal strain rate at middle levels
than to the existence of a mid-level vortex. This
correlation is perhaps not unexpected, as the pattern of
strain rate in the flow implied by low is likely to
import dry air into the core of a prospective tropical
cyclone.
The lower tropospheric vertical shear ranged from 3.4 m s-1 to 6.2 m s-1 according to table 2. The small variance in these rather small shear values is unlikely to explain much about the observed variations in the strength and intensification rate of the systems studied,suggesting that vertical shear values in this range have little effect on tropical cyclogenesis.
Seven points representing five disturbances in each of the scatter plots of figures 10 and 11 constitute a very small sample. For this reason and because the relationships between the variables are generally expected to be nonlinear, linear regression analyses on these plots generally have not been done. The visible trends in these plots are thus considered to be suggestive, not definitive. Nevertheless they paint an interesting picture, which we now summarize.
The key point is that the environment provided by a strong and laterally extensive mid-level vortex appears to be favorable for the development of convection with a bottom-heavy mass flux profile. This aids in the spinup of a tropical cyclone in two ways: (1) The strong mass inflow at low levels implied by such a mass flux profile results in the intense vorticity convergence which is needed to spin up the low-level, warm-core vortex associated with cyclogenesis. (2) The bottom-heavy mass flux profile also tends to produce weaker vertically integrated lateral export of moist entropy, or even lateral import in extreme cases. This favors a positive tendency of column-integrated moist static energy, which in turn tends to increase the saturation fraction in the column. The negative temperature anomaly below the mid-level vortex also acts to increase the saturation fraction. The net result of this higher relative humidity is stronger precipitation, which is associated with increased vertical mass fluxes and enhanced low-level inflow. The increase in saturation fraction is thus key to tropical cyclogenesis in this picture. It is probably no accident that the mission exhibiting the most rapid intensification, Nuri2, also had the highest values of saturation fraction.
Small lateral export of moist entropy is not the only condition needed to allow the column-integrated entropy to increase. Vertical and horizontal shear of the ambient flow can also bring low entropy air into the core of the system. In the cases studied, the vertical shear did not correlate with suppression of intensification; the most sheared system, Nuri, actually exhibited the most rapid intensification. However, strong horizontal shear (or strain), as characterized by low values of the normalized mid-level Okubo-Weiss parameter, is correlated with a failure to spin up in the cases studied here. This failure even occurred in TCS025-2, which exhibited a bottom-heavy mass flux profile and positive vorticity tendencies at both low and middle levels during the period in which it was observed. The most reliable external parameter for indicating spinup in our small sample is thus the normalized mid-level Okubo-Weiss parameter.
Our results are related to the ideas of Yanai (1961, 1968) and Bister and Emanuel (1997), who made the connection between a lower tropospheric cold core and subsequent warm core formation. They are supported by the observational studies of tropical cyclone development from ensembles of mid-level mesoscale convective vortices cited in section 1 as well as the numerical model results of Nolan (2007). However, the mechanism of development presented here is somewhat different (or at least more detailed) than discussed in those papers. Our results leave no doubt that the spinup at low levels results primarily from the horizontal convergence of vertical vorticity at those levels and not from tilting or some putative downward transport of vertical vorticity from above.
We tentatively identify the convection occurring in the moister and more stable environment produced by a mid-level vortex with the VHTs of Hendricks et al. (2004) and Montgomery et al. (2006). Hendricks et al. (2004) and Montgomery et al. (2006) emphasize the role of VHTs in concentrating vorticity into localized swirls, which then interact and combine to form the nascent tropical cyclone vortex. This vorticity concentration is central to the cyclogenesis mechanism in their view. If this correspondence is borne out, then our results would appear to provide some insight as to how VHTs differ from ordinary tropical convection. In particular, we postulate that VHTs exhibit bottom-heavy vertical mass flux profiles. These profiles result in strong concentration of vorticity at low levels; they also result in the suppression of the lateral export of moist entropy by convection.
Whether strong ambient vorticity has a significant effect on VHTs beyond providing fuel for intense vortex stretching is still uncertain. Our results suggest that the modified thermodynamic environment produced by a mid-level circulation is sufficient to explain dramatic changes in convective mass flux profiles, but additional effects due to the vortical environment in which they are embedded (perhaps associated with the rotational suppression of entrainment in an environment with small Rossby radius) currently cannot be ruled out.
Acknowledgments. The data used here were obtained through the efforts of many individuals involved in the TPARC/TCS08 field program, and we acknowledge our debts to all of them. The comments of three anonymous reviewers led to significant improvement of this paper. This work was supported by grants N000140810241 from the Office of Naval Research and ATM1021049 from the US National Science Foundation. C. López was partially supported by Inter-American Institute for Global Change Research grant CRN-2048.
Back, L. E., and C. S. Bretherton (2005), The relationship between wind speed and precipitation in the Pacific ITCZ. J. Climate, 18, 4317-4328.
Bister, M., and K. A. Emanuel (1997), The genesis of Hurricane Guillermo: TEXMEX analyses and a modeling study. Mon. Wea. Rev., 125, 2662-2682.
Bosart, L. F., and J. Bartlo (1991), Tropical storm formation in a baroclinic environment. Mon. Wea. Rev., 119, 1979-2013.
Davis, C. A. (1992), Piecewise potential vorticity inversion. J. Atmos. Sci., 49, 1397-1411.
Bretherton, C. S., M. E. Peters, and L. E. Back (2004), Relationships between water vapor path and precipitation over the tropical oceans. J. Climate, 17, 1517-1528.
Dunkerton, T. J., M. T. Montgomery, and Z. Wang (2009), Tropical cyclogenesis in a tropical wave critical layer: Easterly waves. Atmos. Chem. Phys., 9, 5587-5646.
Elsberry, R. L., and P. A. Harr (2008), Tropical cyclone structure (TCS08) field experiment science basis, observational platforms, and strategy. Asia-Pacific Journal of Atmospheric Sciences, 44, 209-231.
Emanuel, K. A. (1994), Atmospheric Convection. Oxford University Press, 580 pp.
Harr, P. A., R. L. Elsberry, and J. C. L. Chan (1996a), Transformation of a large monsoon depression to a tropical storm during TCM-93. Mon. Wea. Rev., 124, 2625-2643.
Harr, P. A., M. S. Kalafsky, and R. L. Elsberry (1996b), Environmental conditions prior to formation of a midget tropical cyclone during TCM-93. Mon. Wea. Rev., 124, 1693-1710.
Harr, P. A., and R. L. Elsberry (1996), Structure of a mesoscale convective system embedded in Typhoon Robyn during TCM-93. Mon. Wea. Rev., 124, 634-652.
Haynes, P. H., and M. E. McIntyre (1987), On the evolution of vorticity and potential vorticity in the presence of diabatic heating and frictional or other forces. J. Atmos. Sci., 44, 828-841.
Hendricks, E. A., M. T. Montgomery, and C. A. Davis (2004), The role of “vortical” hot towers in the formation of tropical cyclone Diana (1984). J. Atmos. Sci., 61, 1209-1232.
Houze, R. A. Jr., W.-C. Lee, and M. M. Bell (2009), Convective contribution to the genesis of Hurricane Ophelia (2005). Mon. Wea. Rev., 137, 2778-2800.
Jenkins, M. A., and H.-R. Cho (1991), An observational study of the first-order vorticity dynamics in a tropical easterly wave. J. Atmos. Sci., 48, 965-975.
López Carrillo, C., and D. J. Raymond (2005), Moisture tendency equations in a tropical atmosphere. J. Atmos. Sci., 62, 1601-1613.
Maloney, E. D., and A. H. Sobel (2004), Surface fluxes and ocean coupling in the tropical intraseasonal oscillation. J. Climate, 17, 4368-4386.
Miller, M. J., A. C. M. Beljaars, and T. N. Palmer (1992), The sensitivity of the ECMWF model to the parameterization of evaporation from the tropical oceans. J. Climate, 5, 418-434.
Montgomery, M. T., M. E. Nicholls, T. A. Cram, and A. B. Saunders (2006), A vortical hot tower route to tropical cyclogenesis. J. Atmos. Sci., 63, 355-386.
Montgomery, M. T., L. L. Lussier III, R. W. Moore, and Z. Wang (2010), The genesis of Typhoon Nuri as observed during the Tropical Cyclone Structure 2008 (TCS-08) field experiment – Part 1: The role of the easterly wave critical layer. Atmos. Chem. Phys., 10, 9879-9900.
Nolan, D. S. (2007), What is the trigger for tropical cyclogenesis? Aust. Met. Mag., 56, 241-266.
Pauluis, O., and I. M. Held (2002), Entropy budget of an atmosphere in radiative-convective equilibrium. Part I: Maximum work and frictional dissipation. J. Atmos. Sci., 59, 125-139.
Raymond, D. J. (1992), Nonlinear balance and potential-vorticity thinking at large Rossby number. Quart. J. Roy. Meteor. Soc., 118, 987-1015.
Raymond, D. J. (1995), Regulation of moist convection over the west Pacific warm pool. J. Atmos. Sci., 52, 3945-3959.
Raymond, D. J., C. López-Carrillo, and L. López Cavazos (1998), Case-studies of developing east Pacific easterly waves. Quart. J. Roy. Meteor. Soc., 124, 2005-2034.
Raymond, D. J., G. B. Raga, C. S. Bretherton, J. Molinari, C. López-Carrillo, and Ž. Fuchs (2003), Convective forcing in the intertropical convergence zone of the eastern Pacific. J. Atmos. Sci., 60, 2064-2082.
Raymond, D. J., and X. Zeng (2005), Modelling tropical atmospheric convection in the context of the weak temperature gradient approximation. Quart. J. Roy. Meteor. Soc., 131, 1301-1320.
Raymond, D. J. and S. L. Sessions (2007), Evolution of convection during tropical cyclogenesis. Geophys. Res. Letters, 34, L06811, doi:10.1029/2006GL028607.
Raymond, D. J., S. L. Sessions, and Ž. Fuchs (2007), A theory for the spinup of tropical depressions. Quart. J. Roy. Meteor. Soc., 133, 1743-1754.
Raymond, D. J., S. Sessions, A. Sobel, and Ž. Fuchs (2009), The mechanics of gross moist stability. J. Adv. Model. Earth Syst., 1, art. #9, 20 pp.
Raymond, D. J. and C. López Carrillo (2011), Vorticity budget of typhoon Nuri. Atmos. Chem. Phys., 11, 147-163.
Reed, R. J., and E. E. Recker (1971), Structure and properties of synoptic-scale wave disturbances in the equatorial western Pacific. J. Atmos. Sci., 28, 1117-1133.
Reynolds, R. W., and D. C. Marsico (1993), An improved real-time global sea surface temperature analysis. J. Climate, 6, 114-119.
Ritchie, E. A. and G. J. Holland (1997), Scale interactions during the formation of Typhoon Irving. Mon. Wea. Rev., 125, 1377-1396.
Sherwood, S. C. (1999), Convective precursors and predictability in the tropical western Pacific. Mon. Wea. Rev., 127, 2977-2991.
Simpson, J., E. Ritchie, G. J. Holland, J. Halverson, and S. Stewart (1997), Mesoscale interactions in tropical cyclone genesis. Mon. Wea. Rev., 125, 2643-2661.
Sobel, A. H., E. D. Maloney, G. Bellon, and D. M. Frierson (2009), Surface fluxes and tropical intraseasonal variability. J. Adv. Model. Earth Syst., 2, art. #2, 24 pp., doi:10.3894/JAMES.2010.2.5.
Syono, S. (1953), On the formation of tropical cyclones. Tellus, 5, 179-195.
Xu, K.-M., A. Arakawa, and S. K. Krueger (1992), The macroscopic behavior of cumulus ensembles simulated by a cumulus ensemble model. J. Atmos. Sci., 49, 2402-2420.
Yanai, M. (1961), A detailed analysis of typhoon formation. J. Meteor. Soc. Japan, 39,187-214.
Yanai, M. (1968), Evolution of a tropical disturbance in the Caribbean Sea region. J. Meteor. Soc. Japan, 46, 86-109.
Yang, G.-Y., and J. Slingo (2001), The diurnal cycle in the tropics. Mon. Wea. Rev., 129, 784-801.
Zipser, E. J. (1977), Mesoscale and convective scale downdrafts as distinct components of squall-line structure. Mon. Wea. Rev., 105, 1568-1589.
| Label | Date | Reference Time | Location | Propagation Velocity | Comment |
| Nuri1 | 15 Aug | 25.8 hr | 147∘ E,14∘ N | (-7.0,0.0) m s-1 | intensifying TW |
| Nuri2 | 16 Aug | 23.9 hr | 140∘ E,15∘ N | (-8.7,0.0) m s-1 | intensifying TD |
| TCS025-1 | 27 Aug | 0 hr | 152∘ E,19∘ N | (2.4,2.6) m s-1 | strong TW |
| TCS025-2 | 28 Aug | 0 hr | 154∘ E,21∘ N | (2.4,2.6) m s-1 | strong TW |
| TCS030 | 1 Sep | 21.1 hr | 143∘ E,12∘ N | (-6.3,0.6) m s-1 | weak TW |
| TCS037 | 7 Sep | 24 hr | 154∘ E,26∘ N | (-5.7,3.2) m s-1 | strong TW |
| Hagupit2 | 14 Sep | 23.6 hr | 148∘ E,16∘ N | (-2.3,1.1) m s-1 | weak TW |
: normalized Okubo-Weiss parameter in 3 - 5 km layer; |Δv|: shear between 0 - 1 km and 3 - 5 km; SST:
mean sea surface temperature.| Variable | N1 | N2 | T25-1 | T25-2 | T30 | T37 | H2 |
| Fes(J∕K∕m2∕s) | 0.76 | 0.73 | 0.70 | 0.81 | 0.42 | 0.54 | 0.46 |
| Frs(mm∕day) | 6.9 | 6.3 | 6.0 | 7.1 | 3.9 | 4.8 | 4.0 |
| R(mm∕day) | 15 | 53 | 2 | 49 | -6 | 60 | 30 |
| S | 0.81 | 0.88 | 0.85 | 0.86 | 0.78 | 0.82 | 0.82 |
| γ | 0.37 | -0.01 | -2.35 | 0.14 | -0.63 | 0.01 | 0.64 |
| (∂[ρs]∕∂t)(J∕K∕m2∕s) | 0.02 | 0.40 | -0.48 | -0.17 | -0.58 | 0.11 | -1.74 |
| Δs*(J∕K∕kg) | 17 | 11 | 10 | 11 | 27 | 15 | 27 |
| ζlow(ks-1) | 0.072 | 0.093 | 0.080 | 0.072 | 0.043 | 0.115 | 0.065 |
| ζmid(ks-1) | 0.074 | 0.133 | 0.086 | 0.087 | 0.039 | 0.129 | 0.058 |
| (∂ζlow∕∂t)(ks-1day-1) | -0.001 | 0.138 | 0.032 | 0.045 | -0.014 | 0.046 | 0.011 |
| (∂ζmid∕∂t)(ks-1day-1) | 0.045 | 0.037 | 0.116 | 0.002 | -0.004 | 0.018 | 0.061 |
| | 0.99 | 0.85 | 0.67 | 0.57 | 0.52 | 0.95 | 0.48 |
| |Δv|(m∕s) | 6.1 | 6.2 | 5.2 | 4.0 | 5.1 | 3.4 | 5.7 |
| SST(∘C) | 29.7 | 29.9 | 29.5 | 29.3 | 30.2 | 28.2 | 29.9 |
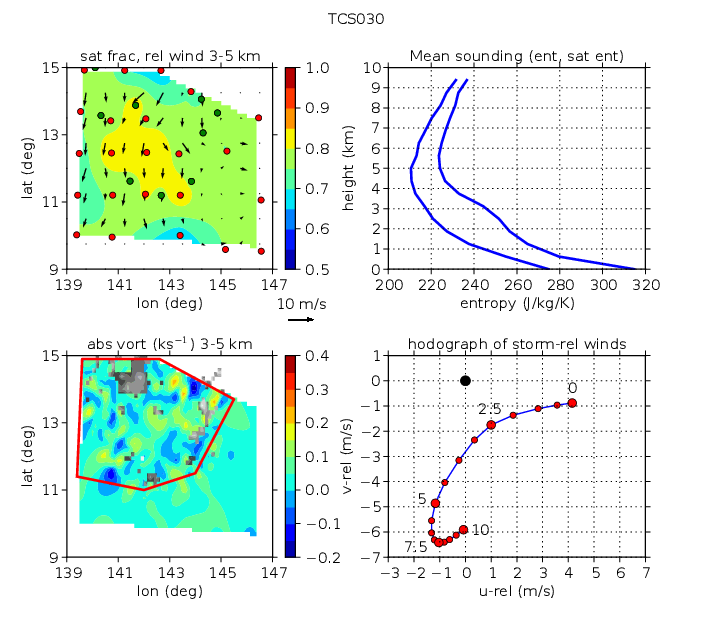
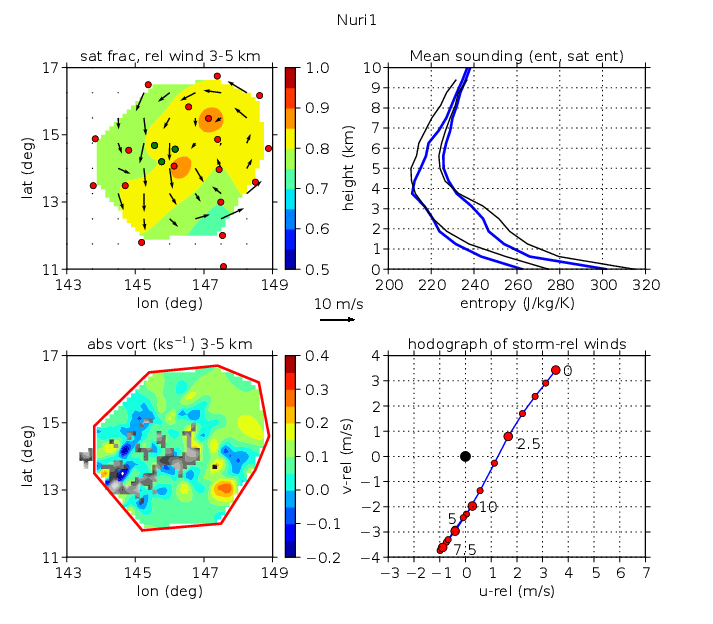
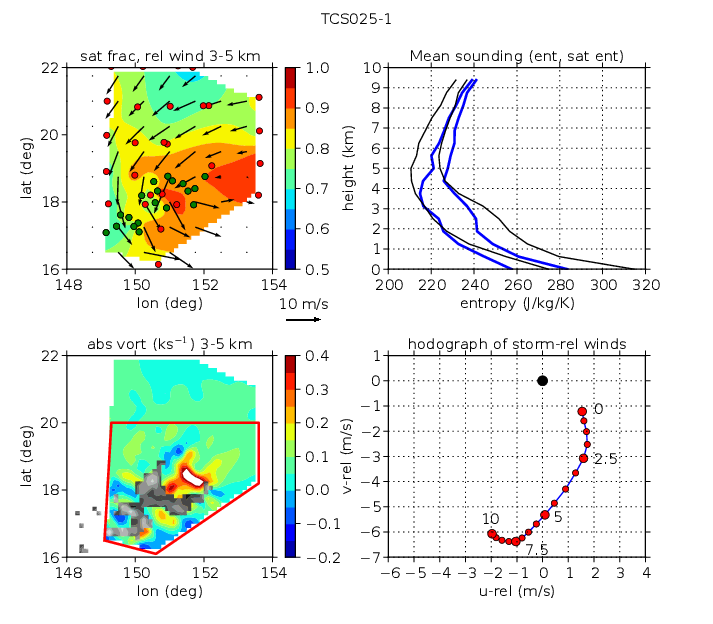
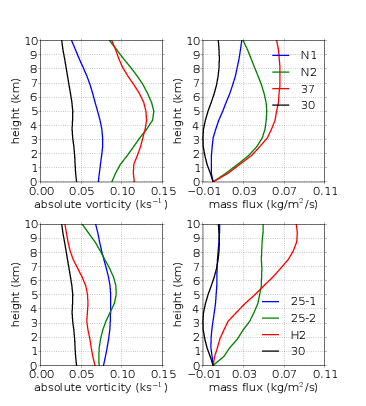
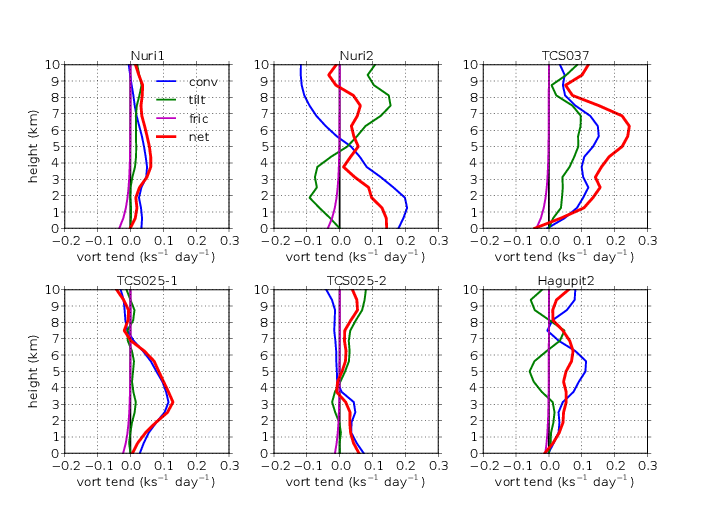
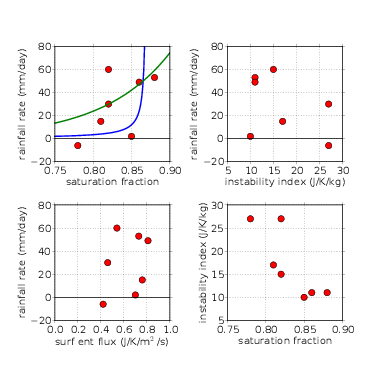
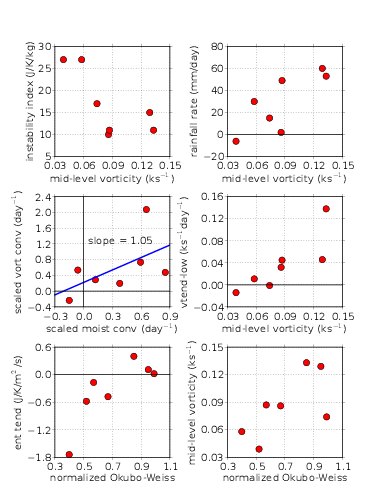
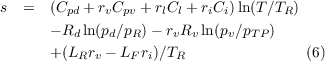
![d[ρs] -- -- ----
----- = F es + Frad - [∇h ⋅(ρvhs)]- ρvzs|h
dt -- -- -- --
= F es + Frad - γL(R - F rs)∕TR (15)](paper318x.png)