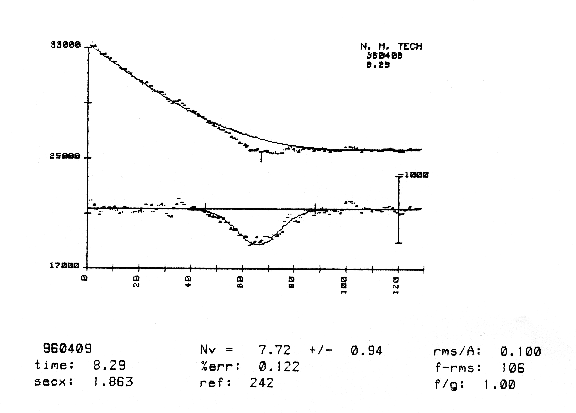
This spectrum was obtained by reflecting sunlight from a mirror mounted on the roof of Weir Hall and passing it through the PEPSIOS instrument. The dots represent the measured intensity and the solid curve is the solar intensity. The difference between the two is due to absorption by OH in the Earth's atmosphere, shown by the Gaussian line profile at the bottom. The scan range is about 0.075 Angstroms centered at 3081 Angstroms. The resolving power is about 500,000.

Based on these data, the total number of OH molecules in a vertical column of atmosphere at that time (about 8:20 A.M. MST) was 7.72e13 molecules/cm^2, with a relative error (1 sigma) of 12%.
We expect much more data from the NMT instrument which will complement the extensive OH database (1978-present) from the Fritz Peak Observatory in Colorado, in addition to previous observations from Florida, Alaska, Micronesia, and New Zealand.